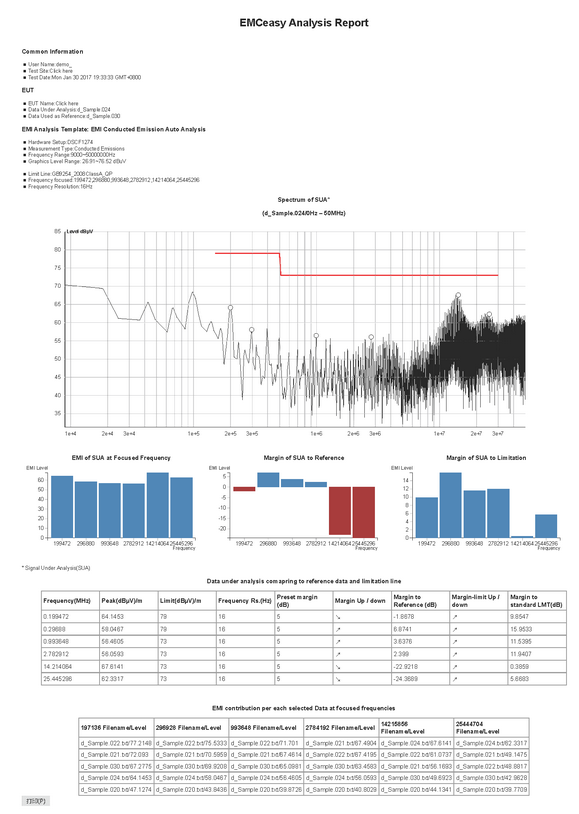
Evaluating the overall EMC status of the EUT at any time during EMI locating and reduction progress helps us to keep track of the progress.
EMI evaluation
Select the original data file of power input of "Reference EUT" in the "Reference" drop-down menu, and select the data file of power input of the "Improved EUT" in the "Data under analyse" drop-down menu, select the desired standard limitation line, multi-select interested waveform data of other test points in the "Extra data" drop-down menu. Click the Analyse button.
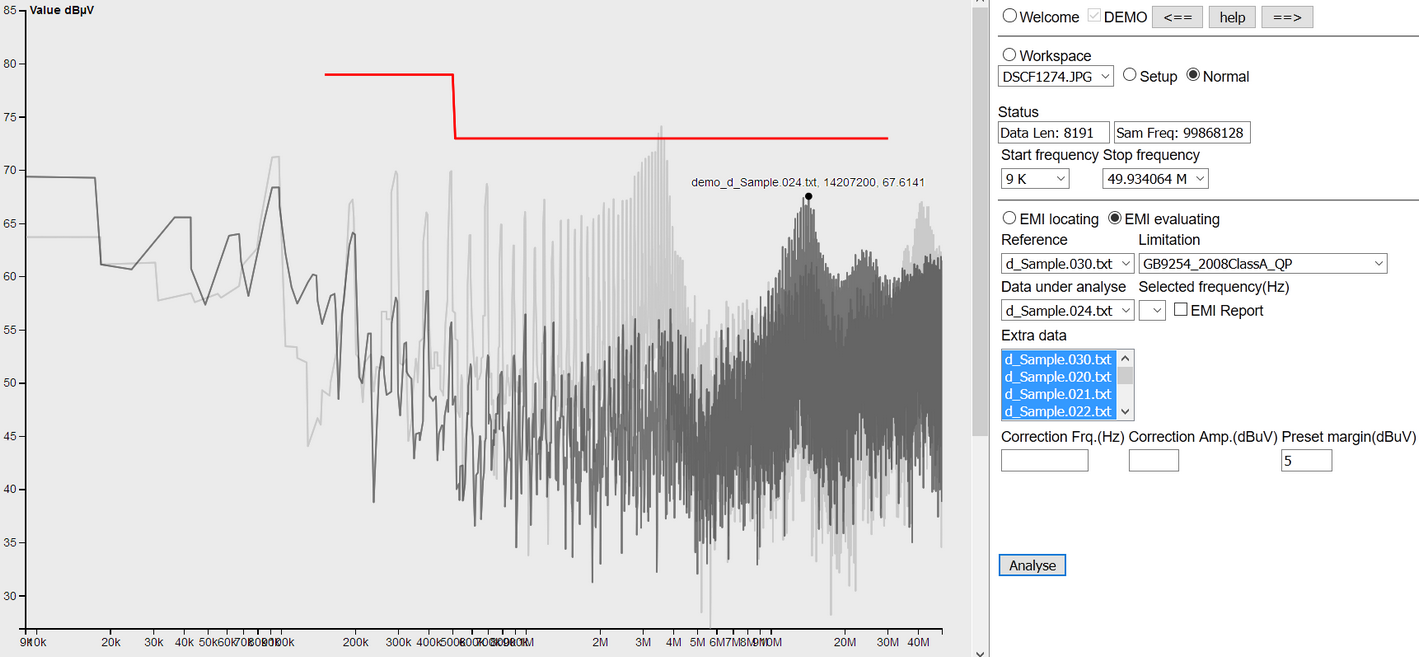
You can find out if the "Reference Data", the "Data Under Analyze" spectrum is exceeded the standard line, move the cursor over the spectrum can further observe the Tool-tip parameters.
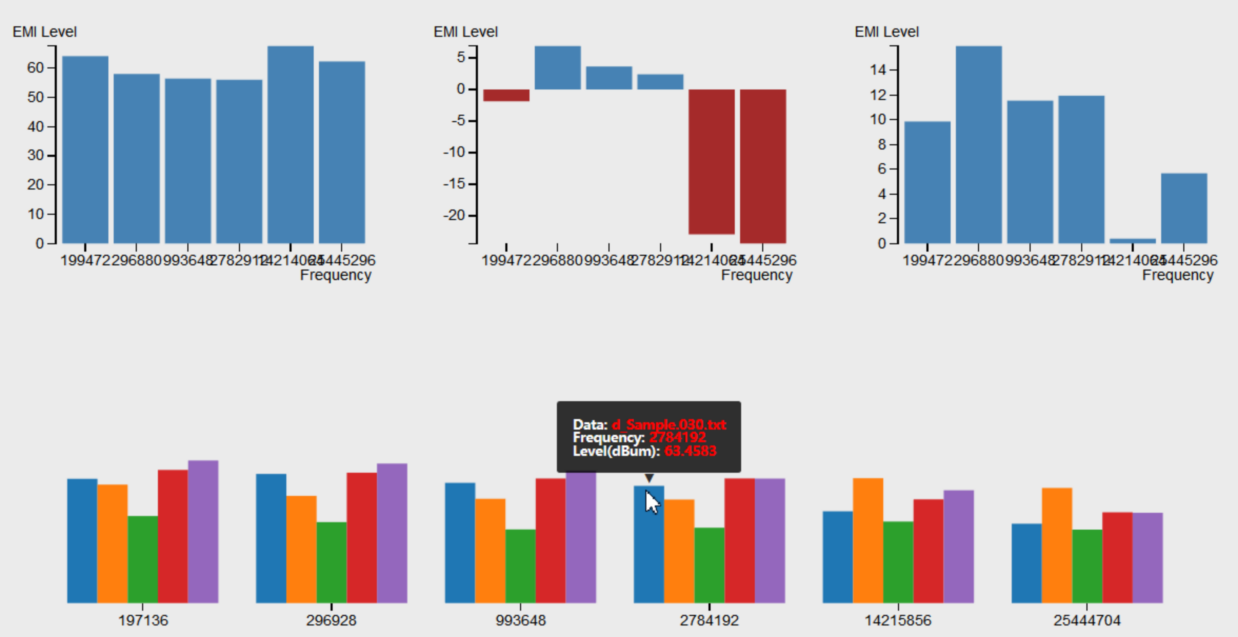
Scroll down mouse wheel or drag the right sidebar down , you will see three group bars as below:
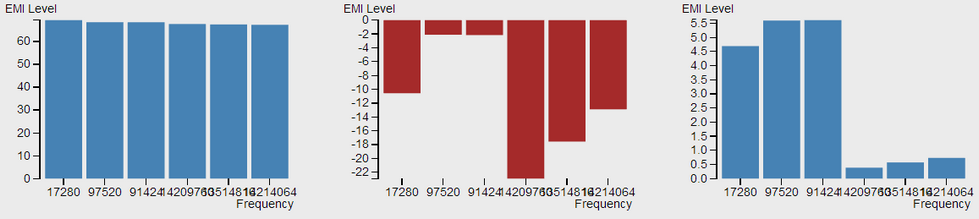
These three group bars show the distribution of EMI at 6 "observed frequency" points which bear the highest amplitude, on the "Data Under Analyse" spectrum, they are:
Left figure, the EMI distribution of "Data Under Analyse" at "observed frequency";
Middle figure: EMI difference at "observed frequency" between "Reference data" and "Data Under Analyse" ("Reference data" EMI - "Data Under Analyse" EMI)
Right figure: EMI difference at "observed frequency" between "Standard Line Value" and "Data Under Analyse" ("Standard Line Value" - "Data Under Analyse" EMI)
Moving the cursor over the bar chart allows you to further observe the Tool-tip data per each column.
In addition to the the 6 "observed frequency" points which are automatically selected by system , the user can left click on the spectrum to manually select the "observation frequency." The selected "observation frequency" will be marked as a red point on spectrum and automatically added to the "Selected frequency(Hz)" drop-down menu of the control panel. Click on the red point again will cancel the mark and remove its corresponding "observation frequency" option from the "Selected frequency(Hz)" drop-down menu as well.
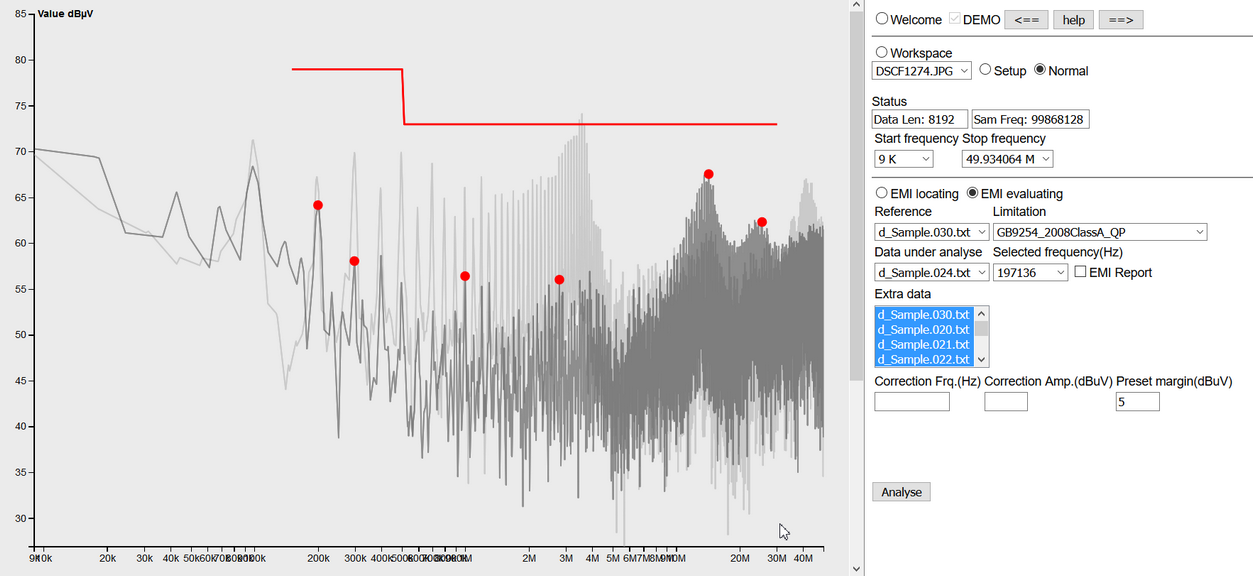
Click the Analyse button to regenerate the spectrum based on the manually selected "observed frequency" points. Scroll down mouse to move the virtual workspace up to see the EMI distribution of the "Data Under Analyse" at the "observed frequency" and all the selected data's EMI distribution ("Reference Data", "Data Under Analyse", and "Extra Data").
Moving the cursor over the bar chart allows you to further observe the Tool-tip parameters per each bar.
EMI Report
During the above EMI evaluation analysis process, you can check the "EMI report" option at any time, and the system will generate a evaluation report based on the current evaluation analysis result. To re-generate the evaluation report, uncheck and recheck the option again. Evaluation report can be printed or saved as a PDF file.
Note:
Margin to standard LMT = Limit - Preset margin - Peak
Margin to Reference = Reference - Preset margin - Peak
where
"Preset margin" is 5 by default, and can be changed by inputting a new value at "Preset margin" box on control panel during "EMI evaluating".
User can input name of the test site by clicking "Test Site" under "Common Information", and input EUT name by clicking "EUT Name" under "EUT".