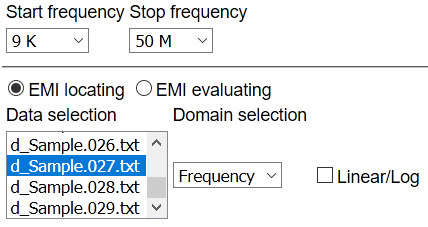
“EMI locating” feature is available when corresponding radio button is checked.
Data Selection
Choose the data file you want to analyse.
Multi-data selection is available when "Domain Selection"–>”Frequency” is chosen.
Domain Selection
Options:
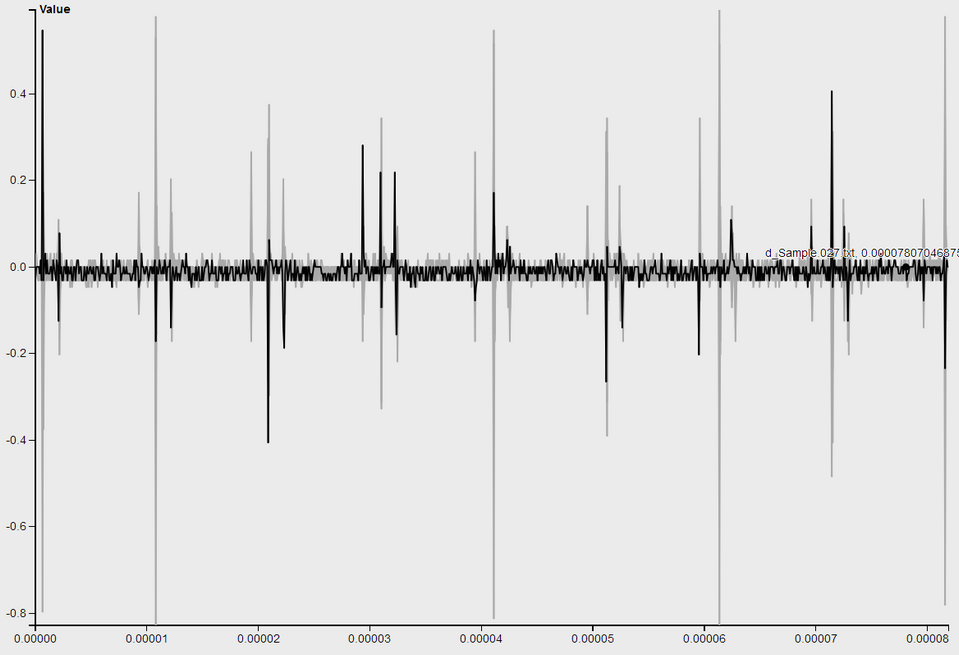
“Time” domain option is used to display the waveform of original data. Move mouse over the waveform shows the detail information.
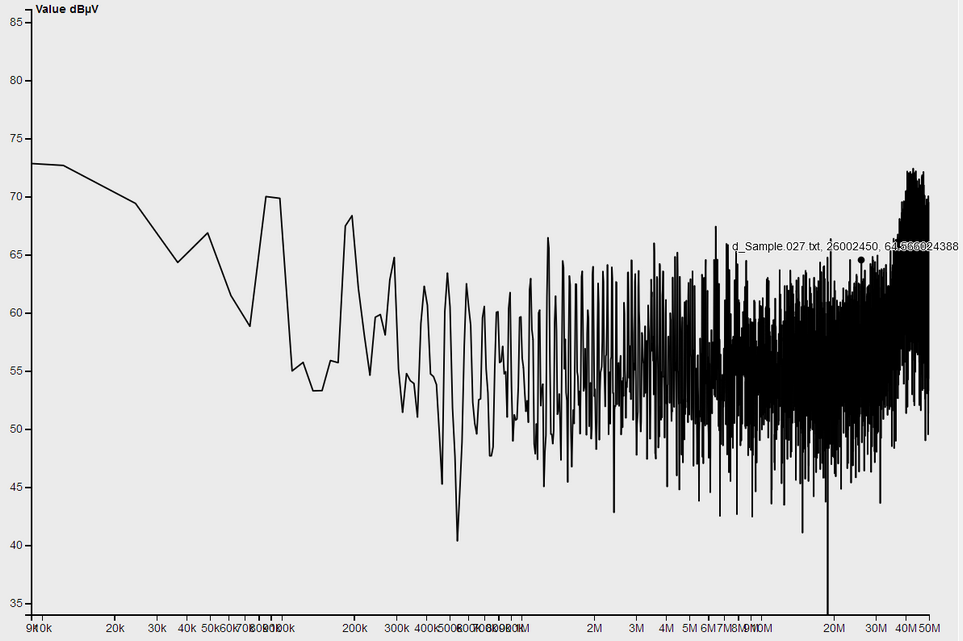
“Frequency” domain option is used to display the frequency analysis results of a signal or multiple signals. Move mouse over the waveform shows the detail information.
"Time/Frequency" option is used to perform Time/Frequency (Wavelet) analysis, results compose of four frames:
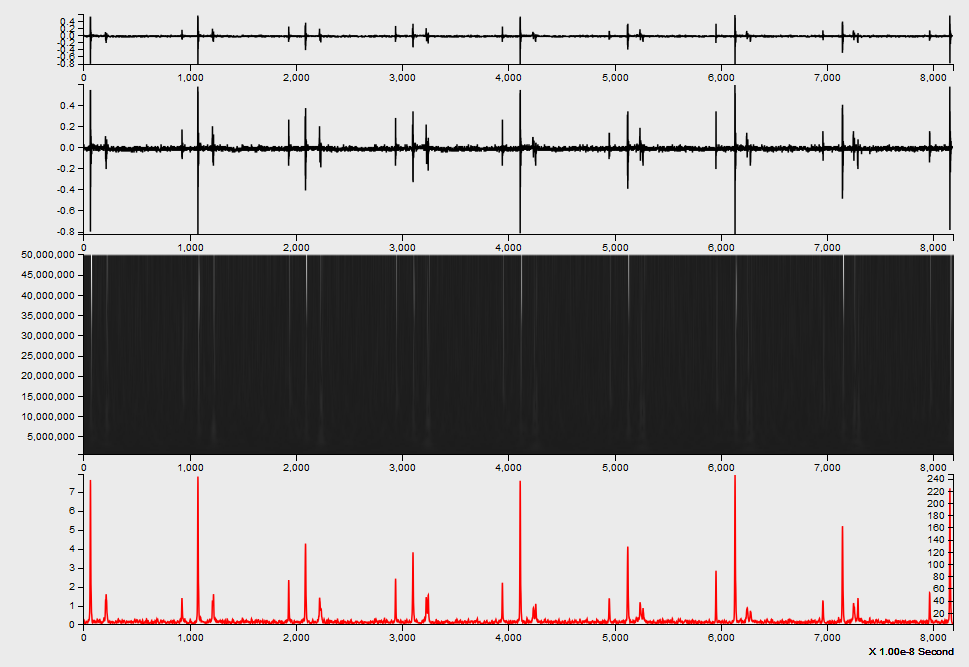
from top to bottom they are
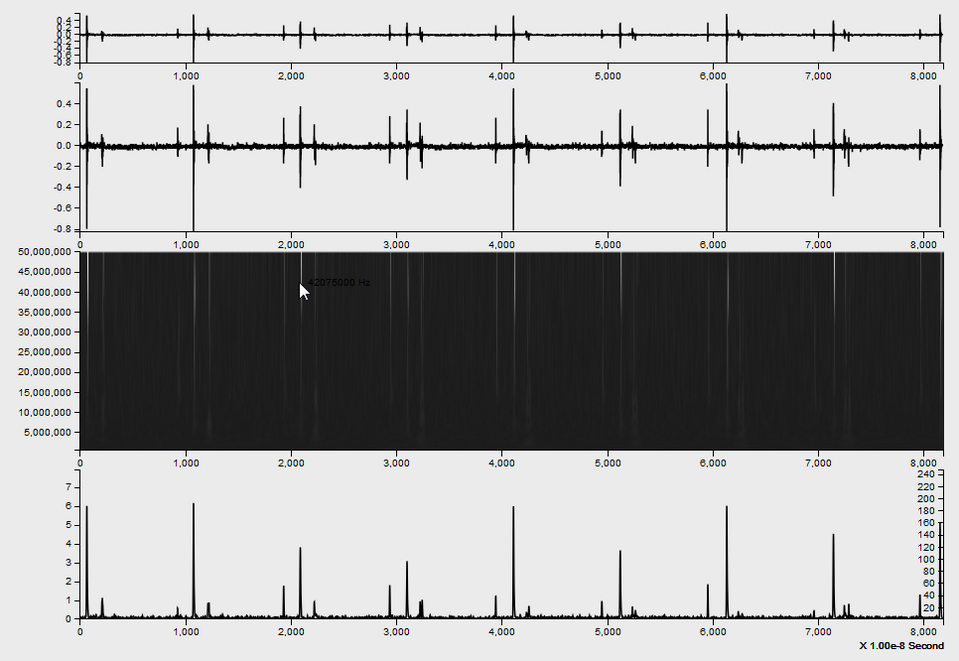
Frame 1: Original signal.
Frame 2: Original Signal in Detail, used to display the box selected area of original signal of frame 1. The waveforms of both fame 1 and 2 are equal when there is no box selection on frame 1.
Frame 3: Signal time/frequency domain image. The Y axis represents frequency, X axis represents time, the brightness of image represents the frequency component (EMI) strength ( brighter the image is, stronger the EMI is.).
Frame 4: Display signal frequency variation over time. Red waveform represents the signal energy variation over time, corresponding to the coordinate of right-side Y-axis; Black waveform represents the signal amplitude variation of specific frequency over time corresponding to the coordinate of left-side Y-axis.
When mouse hover on the time/freq image of frame 3, the signal amplitude variation of specific frequency over time (black waveform) is displayed on frame 4, its amplitude is indicated by the left-side Y-axis of frame 4.For example; the frame 4 of figure below displays the amplitude variation of 42075000Hz frequency component of the signal, the amplitude at time 2090X1.00e-8 Second is 3.8.
Note: The time axis is indicated by data points which will be gradually increased during cloud computing until equal to the length of the data according to an optimized download algorithm.
Rectangular Select Operation
Tapping and holding on the left mouse button, drag mouse to form a rectangular box to contain an area you desire to inspect, release the left mouse button then the selected waveform will be displayed in detail in frame 2, and its corresponding computing results will be displayed on frame 3 and 4.
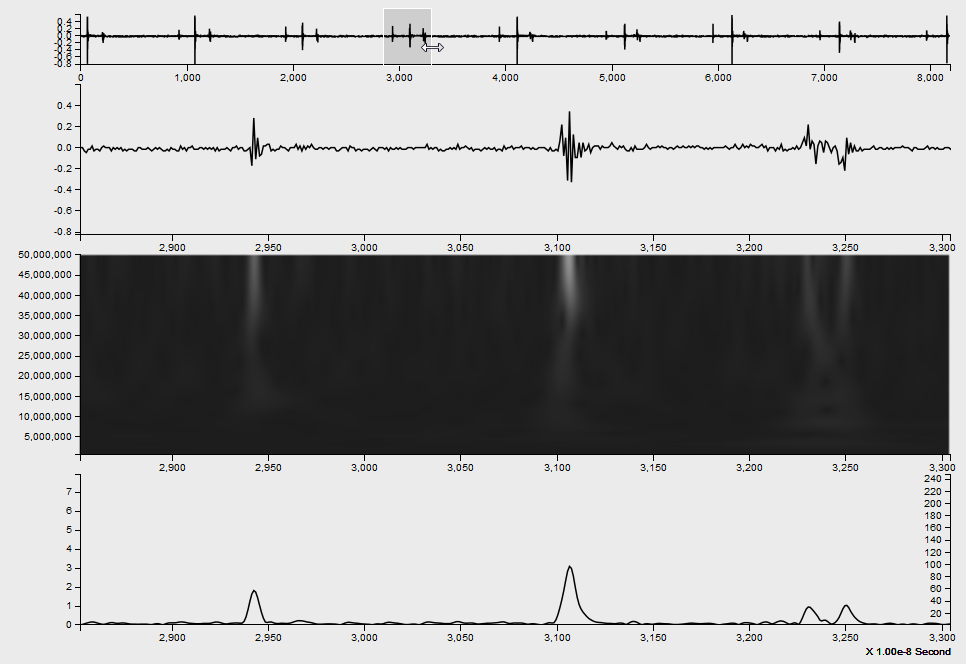
After the partial waveform are rectangular selected, the rectangular box still can be enlarged or narrowed by moving cursor to its side boundary and dragging cursor with the left mouse button on hold ; the display of relevant frames will keep changing simultaneously.

After the partial waveform are rectangular selected, the rectangular box still can be moved along the waveform by moving cursor to its center and dragging cursor with the left mouse button on hold ; the display of relevant frames will keep changing simultaneously.

After the partial waveform are rectangular selected, the rectangular box can be canceled by moving cursor out of box and click the left mouse button; the display of relevant frames will be reset.

Notes: During the above-mentioned rectangular select operation, the frequency component of frame 4 is shown in a frequency which has been set by cursor when it detached from frame 3. Move mouse back to the frame 3 will update the display of frequency component of frame 4.