Auscultation on circuit board
Select "Workspace"->"Normal", by moving cursor over test point on virtual workspace, cloud computing will turn the TP into audible by using our unique algorithm called "inaudible signal auscultation". Distinguishing differences of noises by listening TPs one by one. Please note that the amplitude of all test point signals is normalized and played at the maximum volume, and the tone and pitch are dependent on the signal waveform morphology.
Select: Workshop->Normal, move mouse over any green TP, the represented data will be high lighted on "Data Selection" list of control panel, and user can hear the audio of that TP simultaneously, identify the interference type differences by listening to different TP on different location.
EMI locating on circuit board
By using "EMI locating" feature to compare spectrum of all the data file to find out which corresponding data file which has the largest EMI value of specific frequency, select "Domain selection -> Frequency", then multi-select the data files on the “EMI locating->Data Selection” list.
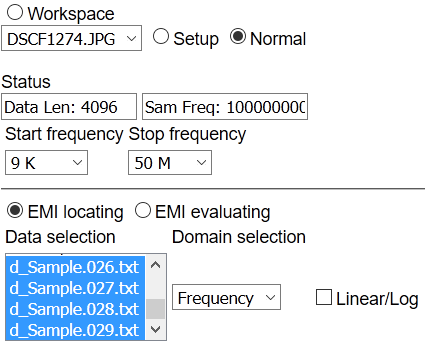
Click "Analyse" button to see the spectrum of all selected data file being calculated by "9 point average method".
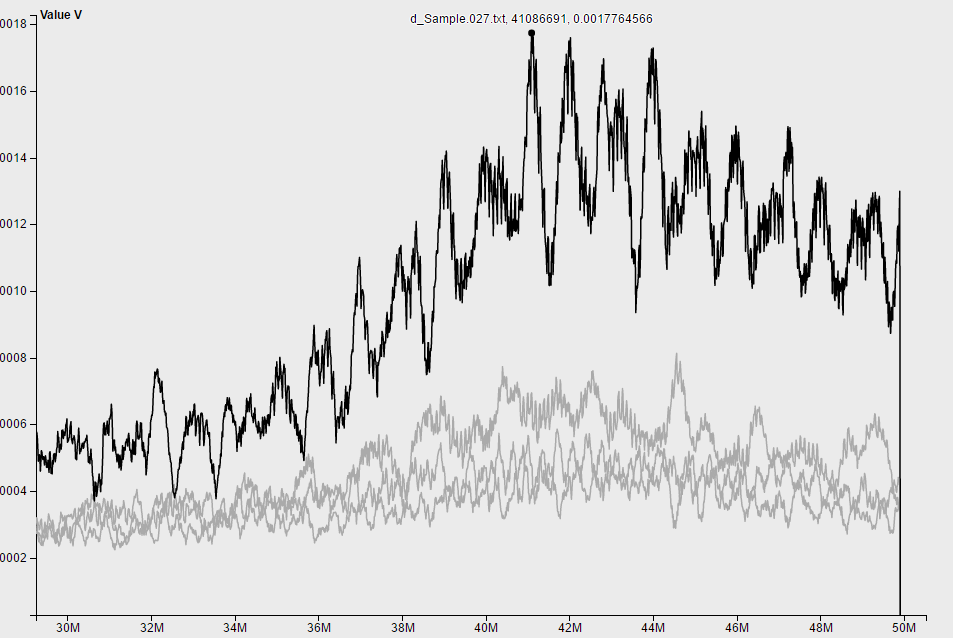
Assume EMC laboratory result indicates that EMI exceeded standard limitation at 42 MHz, move cursor over the highest amplitude on that frequency to find out Tooltip including its file name and parameters, which represents the data file has the highest EMI value at specific frequency. Select that file name on the option list of "Data selection", then select "Workspace->Normal" to display virtual workspace.
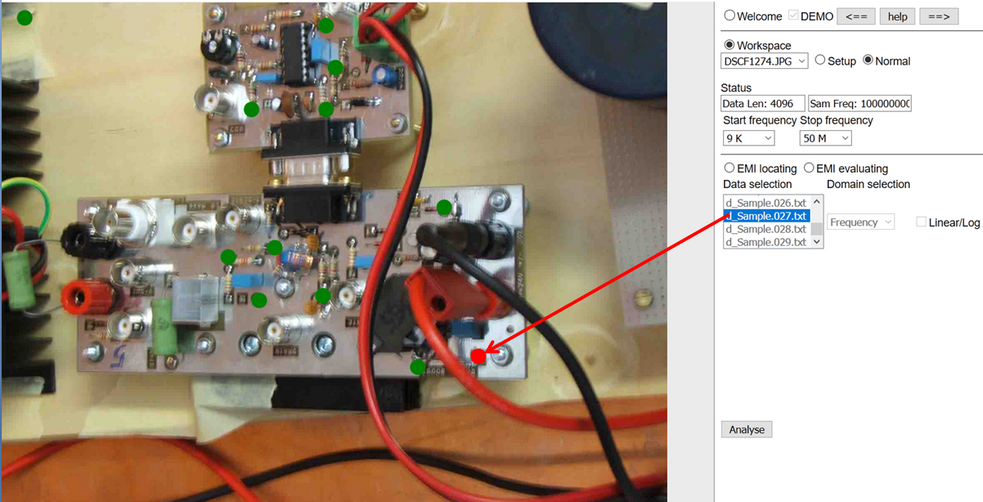
One of TP balls turned red represents the physical position on circuit board of the data selected in Data Selection List which has the biggest EMI value of specific frequency.
Waveform locating on circuit board
Select "EMI locating", "Work Space -> Normal", choose the data file produce the highest EMI which is "d_sample.027.txt" on the “EMI->Data Selection” list, select “Time/Freq” option under “EMI -> Domain Selection”, click “Analyse” button to start time/frequency domain analysis.
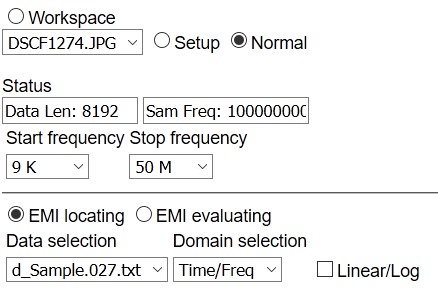
Time/Frequency analysis results are as followed:
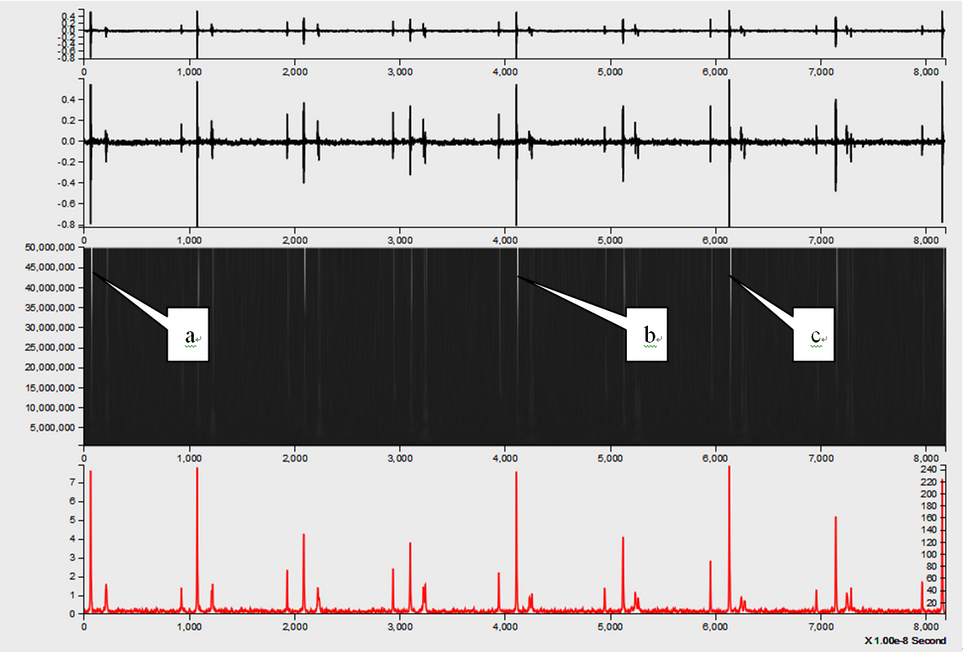
Time/Frequency analysis results compose of four frames, from top to bottom they are: 1. Original signal draft; 2. Original signal detail diagram; 3. Signal Wavelet analysis image; 4. Signal energy variation over time (Red waveform, corresponding to the coordinate of right-side Y-axis) or Signal amplitude variation of specific frequency over time (Black waveform, corresponding to the coordinate of left-side Y-axis).
By observing the third frame of wavelet analyse, you will find there are EMI peaks at time a, b ,c of X Axis and 42 MHz of Y Axis, these peaks correspond specific points on waveform of signal and indicate the EMI locations on waveform.